
September 22nd’s U.S. FOMC (Federal Open Market Committee) central bank meeting was without doubt more hawkish than expected.
Chair Jeremy Powell made it clear that the ‘taper’ announcement of $120 billion per month quantitative easing would start in November unless the data came in weaker than expected.
He also said, ‘substantial progress on jobs has been made’, ‘substantial progress on inflation has been made’ and ‘gradual tapering to conclude around mid-2022’.
Not only is this taper schedule more aggressive than the market has been expecting, but the subsequent ‘dot plots’ showed the FOMC board members also becoming more aggressive, with their interest rate hiking expectations pricing 7 rate hikes by 2024 rather than the 3-4 currently priced by the Eurodollar/STIRT (short term interest rate) curve.
Related articles:
But this emergence has now passed.
In the U.S., unemployment has fallen from 14.8% to 5.3% (which the Fed predicted would be 3.5% in 2023), house prices have risen 19.1% YoY (S&P CoreLogic Case-Shiller Index), the Nasdaq has risen 123% from its COVID-19 lows, there are 10.93 million job vacancies in the U.S. (JOLTS Index) and inflation has risen to a worrying (and not transitory) 5.3% YoY.
So, what will the taper mean for asset prices?
Before the Fed meeting, we were already starting to see early signs of weakness in U.S. equity markets.
The S&P index this week fell below its 50-day moving average for only the third time in 12 months, but more concerning is market breadth, the participation of stocks making up the index.
The chart below shows the New York composite index (white) and the percentage of stocks above their 200-day moving average (orange).
Clearly, the number of stocks above their respective 200 day moving averages has been falling since May when we also saw the top in risk assets like copper, EURJPY, AUDJPY and the lows in the dollar index.
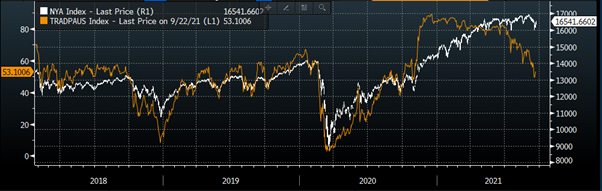
NYSE composite index against the percentage of stocks above the 200-day moving average. A clear breakdown of internal strength (breadth). (Source: Bloomberg)
A strong uptrend needs strong participation, and this is no longer a strong uptrend.
In fact, the S&P 500 index has recently broken below the long-term support line from March 2020, and this week it also broke below the key 50 day moving average, a support and risk management level popular with technical traders.
Also, the Russell 2000 index has been trading sideways since January. Couple this with a soon-to-be tapering central bank, these are not signs of a strong market.
Admittedly, it is not a down trend yet, but if the Russell 2000 breaks below 2127 then all bets are off.
It needs to regain the 2350 level to resume the bull market uptrend again.
Manage risk accordingly!
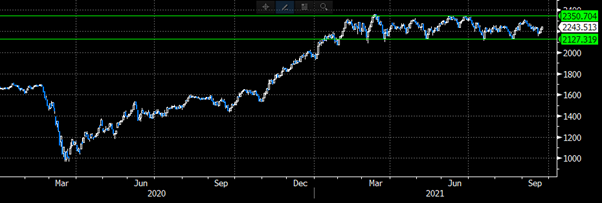
Russell 2000 index. Clear lines in the sand, above 2,350 the uptrend resumes, below 2,127 and stop loss levels are triggered and the index will fall aggressively. (Source: Bloomberg)
The more hawkish central bank (followed today by a more hawkish Bank of England) has also driven yields higher.
The below chart highlights the 10-year U.S. government bond yield which today (September 23rd) broke aggressively out of the previous 3-month range.
We would expect to see convexity hedging now drive the 10-year yield higher, and the short end of the curve to reprice nearer to the Fed dots plots of 7 rate hikes by 2024, rather than the current 3-4.
These curve moves will also propel the dollar higher and act as another headwind to asset prices.
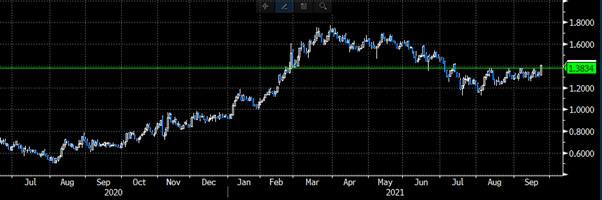
The U.S. 10-year yield breaking aggressively above key resistance level 1.38% which had marked the top of the range for the last 3 months. (Source: Bloomberg)
And finally, of course, the U.S. dollar.
The dollar index actually bottomed earlier this year and with a more hawkish central bank, has the ability to break above the key resistance line 93.43 opening up a long-term trend higher.
The main component of the dollar index basket is EURUSD, and the U.S. economy is in far stronger health than the Euro area and yield curve adjustments we saw above are also driving the currency higher.
Again, watch the price action and manage risk in these changing circumstances.
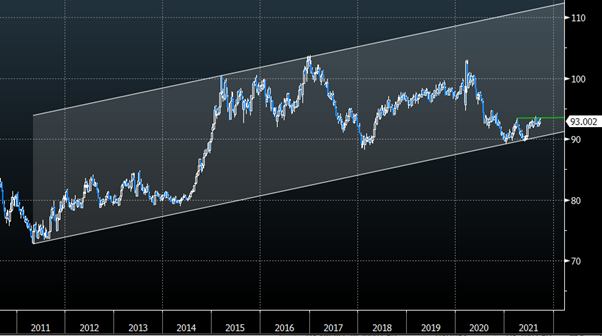
U.S. dollar index sitting just below key resistance level 93.43. A break above her has the ability to open up a strong and protracted trend higher. (Source: Bloomberg)
And finally, on a separate note, those on social media want to argue whether the Evergrande debt crisis in China is another Lehman event.
It seems odd to me that people choose the most extreme events to compare and decide whether this is a major risk or not.
Housing makes up 80% of personal wealth and land sales make up 40% of local government revenues. This will take time to play out. The recurring theme? Watch the price action and manage risk!