

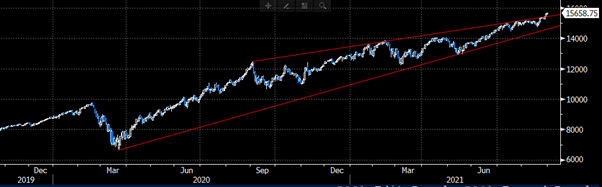
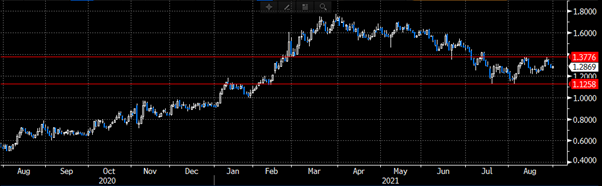
Despite regional Fed governors Bostic, Harper, Mester, Waller and Bullard all calling for an earlier ‘taper’ of quantitative easing in the U.S. the central bank Chair Jeremy Powell took a more dovish stance at the Jackson Hole symposium boosting U.S. equities to fresh all-time highs and weakening the dollar.
Now the financial markets focus on the next key event, U.S. employment data on Friday 3rd September as they flip-flop between events hunting for clues as to when the Federal Reserve will start to reduce its $120 billion per month bond buying program.
Now the financial markets focus on the next key event, U.S. employment data on Friday 3rd September as they flip-flop between events hunting for clues as to when the Federal Reserve will start to reduce its $120 billion per month bond buying program.
As human beings one common behavioral bias we have to be aware of is confirmation bias.
We typically look for narrative to support our thesis, while ignoring opposing arguments. But the reality is that the only determinant of profit and loss in trading and investing is not our fundamental view, but the price. And for every bullish thread somewhere there is usually one with an equally bearish tone.
As we see with the inflation/deflation debate there are two sides to the story. There are strong arguments for inflation: global monetary policy, QE, negative rates, supply chain break downs, asset & commodity prices rises and expansionary fiscal policy but there are also valid arguments supporting the longer-term deflation thesis: deflationary output gap, global debt overhand, demographics, new technologies, the declining velocity of money, plus the end of stimulus cheques, mortgage/rent relief, PPP loans and so on.
Headlines are typically attention grabbing and this week we have seen Germany’s highest import prices since 1981, Eurozone inflation hits 10-year high, UK has a shortage of 90,000 delivery drivers, the Federal reserves preferred PCE inflation gauge posting its fastest annual gain in 30 years, and Aluminium prices hit 10-year high.
We hear less about other deflationary effects such as falling global money growth (US M2, China M2, UK M4, EU M3, AU M3, Cad M3) and weakening global economic indicators, plunging China credit impulse and China’s 2nd worst non-manufacturing PMI print on record.

Continually higher U.S. equity prices on lofty valuations
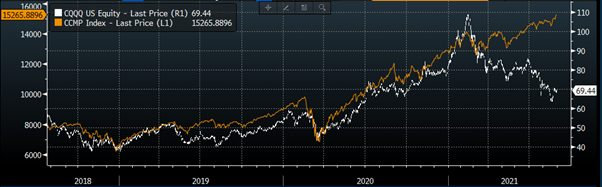
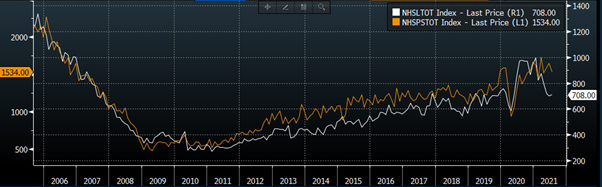
The house party is finishing
U.S. 10 year yields ready to break aggressively.
Is a grand default on the horizon?

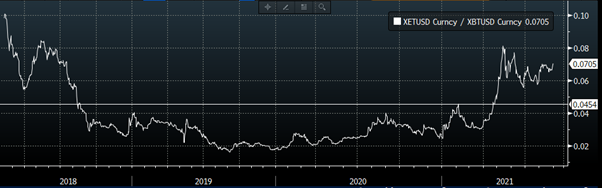
Bitcoin versus Ethereum
This week’s key data