The markets breathed a sigh of relief after U.S. headline CPI data came in slightly ‘below' expectations at +5.3 percent YoY, but the details are less encouraging.
Car rentals were down -8.5 percent, plane tickets were down -9.1 percent, and hotels were down -3.3 percent, accounting for the majority of the change.
The major source of concern is that global food prices are now 33% higher than they were a year ago, and are nearly as high as they have been in the last 60 years.
Related articles:
Will the FED ever Taper? And the Contagion Risk from China’s Property Developers
Extreme Equity Valuations and Possible Bond Defaults
What are the Market Risks Rising Going into the Jackson Hole Symposium?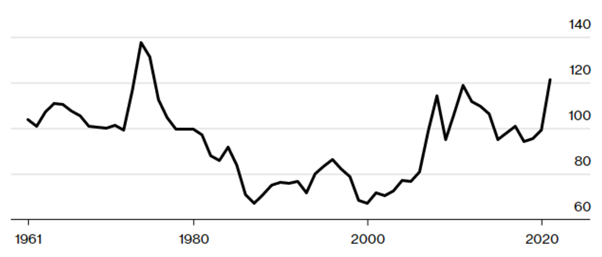
Annualized and inflation-adjusted real food price index (Source: UN’s FAO)
Energy prices are also causing concern, particularly in Europe.
On the N2EX platform, UK day ahead electricity prices (below) have risen nearly 1000 percent from their average 2020 price to GBP 414 per MWh. Natural gas prices have also risen dramatically since April, more than doubling in price.
In the run-up to Europe's winter season, these increases will be a major source of concern for households, businesses, and governments, with the Italian government already promising to use public funds to limit energy price increases.
Indeed, one fertilizer manufacturer in the United Kingdom (CF Industries) has already had to shut down two plants due to rising natural gas prices; expect more to follow as the risk of rolling blackouts grows.
Inflation may be temporary, but retail price increases are not. Inflation is a type of taxation that is currently making consumers very uneasy.
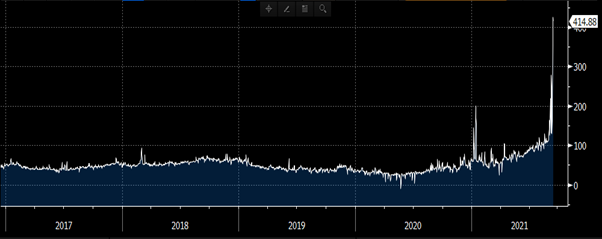
UK day ahead electricity price (N2EX Power Exchange, Source: Bloomberg)
The likelihood that the CCP will bail out Evergrande and that this is a one-time occurrence is dwindling. Banks were notified today (15 September) that Evergrande will not pay interest due on September 20th, and Fitch downgraded the property developer to CC from CCC+ (Source Fitch Wire).
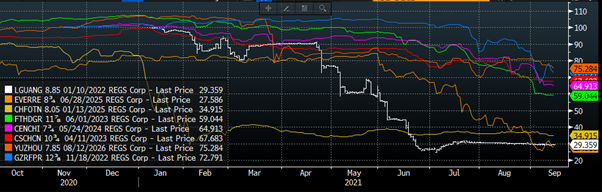
More concerning is the fact that the risks are rapidly spreading, with other developers' bond prices and market capitalizations plummeting.
The chart below shows the prices of 8 other property developers bonds, which range from 25c to 75c in the dollar.
Evergrande’s onshore debt alone of $300 billion is bigger than the GDP of countries like Ireland and Denmark, and it owns just over 2% of China’s real estate.
In China, investors are protesting, and the company has 1.5 million deposits on properties it has yet to complete. A significant portion of China's GDP from the previous decade is laying empty and in default.
This week, China has seen a slew of weaker-than-expected data. Retail sales increased by only 2.5 percent year over year (expected to increase by 7.0 percent), and industrial output increased by only 5.3 percent (+5.9 percent expected).
The Delta variant appears to be a concern as well, with the government today advising students and teachers not to travel during the holiday season (Source: Bloomberg).
Systemic stress and long-term stagnation appear to be on the cards, but hopefully not a financial crisis. Soon, expect a reaction and support from central banks.
With lockdowns in Australia (NSW and Victoria), the central bank delaying their ‘taper,' employment falling sharply (August -146,300, the second worst number on record), China, a key trading partner slowing, and now iron ore prices collapsing (front contract down -41% since July), the Australian dollar is now reversing much of its 2020 gains.
The AUDJPY (below) is a key risk indicator, and it peaked in early May. The ‘risk off' trade is intensifying as Asia-Pacific PMIs (purchasing managers indices) also show contraction.
The AUDJPY's key support level is 78.14, and a close below this level will likely trigger broader risk asset selling.
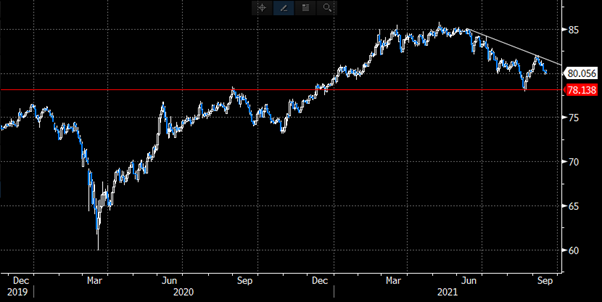
AUDJPY recently sold off from a perfect resistance line and now falls towards key support level of 78.14 (Source: Bloomberg)
The S&P 500 index in the United States (below) has broken a key support line of a rising wedge, a key reversal pattern, this week.
At 4,430, the price bounced off the popular 50-day moving average. If the index closes below this level in the coming days, it will be in a downtrend, with its next target being the 200-day moving average at 4,094, nearly 10% lower.
The record amount of leverage in asset prices in the United States has increased the risks, but regardless of the bullish and bearish narratives circulating on social media, the only arbiter of profit and loss is the price.
A close below 4,430 is bearish, but the bulls maintain control above that level.
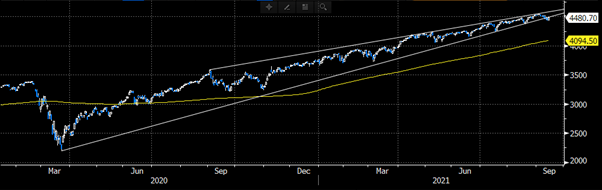
U.S. S&P Index – holding key support at 4,430. (Source: Bloomberg)
Of course, the deterioration of the correlation between the S&P 500 index and the Dow Jones transportation index (shown below) is concerning.
The transportation index reached its high point in May and has been on a downward trend since then.
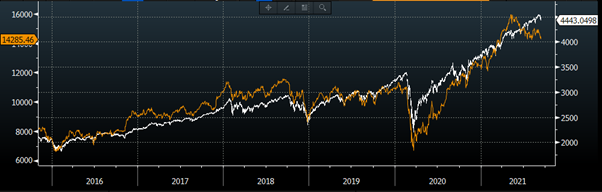
S&P 500 versus the DJ Transportation index which peaked in May as did the AUDJPY currency (Source: Bloomberg)
The key event next week is the U.S. central bank meeting on 22nd September.
This is the key event risk that will drive asset prices, trends and risks next week. All eyes are back on Jeremy Powell the Federal Reserve chair.