Friday, the 27th of August sees the U.S. central bank governor Jeremy Powell speak at the world central bank’s annual economic symposium at Jackson Hole Wyoming.
Central bankers have long used their Jackson Hole keynote speeches to signal important shifts in monetary policy and the market waits to hear if Jeremy Powell signals any imminent start to the Federal Reserve’s quantitative easing ‘taper’ process.
Whilst most Wall Street economists expect the signal to come in the 4th quarter of the year, we have seen the Bank of Korea unexpectedly raise interest rates by 25 basis points today, the 26th of August. While the delta variant continues to spread across the U.S., and we have seen recent global economic data coming in below expectations - the U.S. economy still appears to be strong with job vacancies exceeding those actually looking for jobs.
With equity prices at all time highs (S&P 500 and Nasdaq), home prices at all time highs, job openings at all time highs, wages at all time highs, and core CPI inflation at the highest level since 1991, is $120 billion of monthly asset purchases by the central bank really necessary? In fact, the U.S. central bank has bought 57% of all Treasury issuance over the last year.
After more than a decade of central banks quantitative easing, Jeremy Powell knows any perception by the financial markets that he is becoming more hawkish will probably see an aggressive reaction. Here are some key levels to watch.

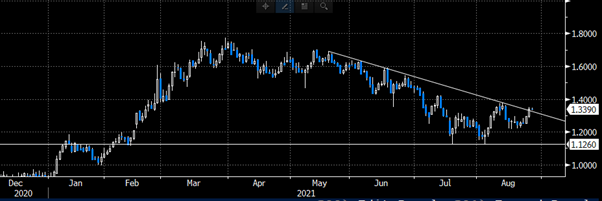
When Powell finally does announce the start of the ‘taper’ process, the U.S. 10-year government bond yield will jump higher. Currently at 1.34%, it is already rising after a 1.12% double bottom, and currently trying to break a 4-month resistance line.
A break above the 1.40% level will likely see an aggressive run higher. In fact, with CPI currently at 5.4% and not looking ‘transitory’ it is difficult to understand why yields are currently so low.

U.S. 10-year government bond yield (Source: Bloomberg)
Any hawkish signals will also see the U.S. dollar continue to rise. Despite 2020 calls about the ‘death of the dollar’. The dollar index has bounced in 2021 from a double bottom 89.50.
Related article: The Implications of a Stronger Dollar
A rally back above 93.50 will see a continued trend higher, bringing with it more pain to emerging markets and further weighing on commodity and equity prices.

The dollar index (Source: Bloomberg)
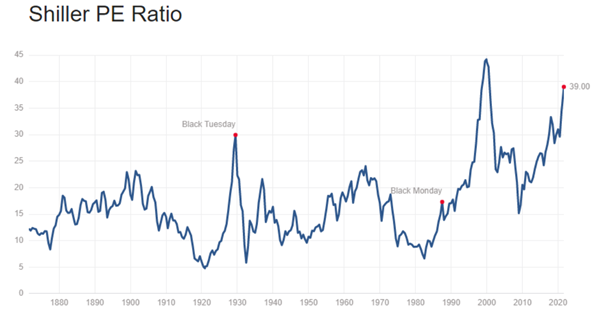
Equities are no doubt expensive when looking at historical comparisons with the highest price/sales ratio ever. Even the Shiller PE ratio is close to the 2000 peak, but the S&P and Nasdaq continue to trend higher.

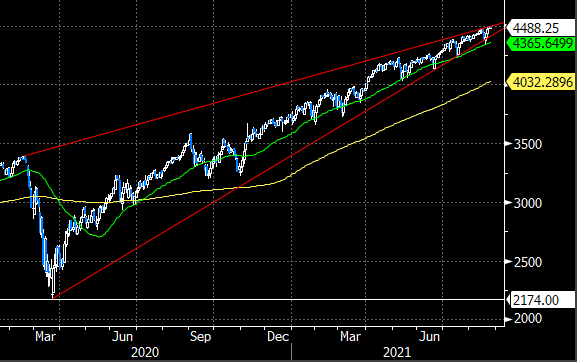
Trend following traders know well that the trend is assumed to be in effect until it gives conclusive signals that it has reversed. The S&P is clearly still trending higher, but complacency is also rising. There has not been a 5% correction in over 200 trading sessions and investor short interest (the willingness to bet on market declines) is the lowest since 2020.
The trend is undoubtedly higher, but the tipping point will be a break of the rising support line, next support will be the 50-day moving average (currently 4365) and finally the 200-day moving average (currently 4032). The trend is currently higher but it’s good to know the risk levels. Risk management 101!

S&P 500 Index rising wedge pattern (Source: Bloomberg)
Perhaps more interesting is the Russell 2000 Index which has been in a sideways range since the start of the year. What technical analysis does tell us is where market participants are likely to be active. A break above 2,350 and new buyers will come into the market.
However, 2,127 is a critical support line that has held 5 times. A break below here will see stop loss liquidation of long positions and selling interest from new speculative short positions. This could be the key level to watch regarding risk in all of the U.S. equity markets.

Russell 2000 Index (Source: Bloomberg)
Jeremy Powell continues to walk a tightrope, and he knows it!


