
The last 12 months has seen unrivaled demand for residential property globally.
Fueled by record fiscal and monetary stimulus, low mortgage rates (the U.S. Federal Reserve have bought over $2 trillion mortgage-backed securities since March 2020), mortgage ‘holidays’, an explosion in savings due to lock-down, stamp duty exemptions, surging demand for suburban and rural property due to the new work from home regime, and record low housing inventory.
In the U.S. family home prices rose 18.1% year-on-year (to $374,000 median price in June) with existing home prices rising a more dramatic 23.5% over the same period (US commerce department).
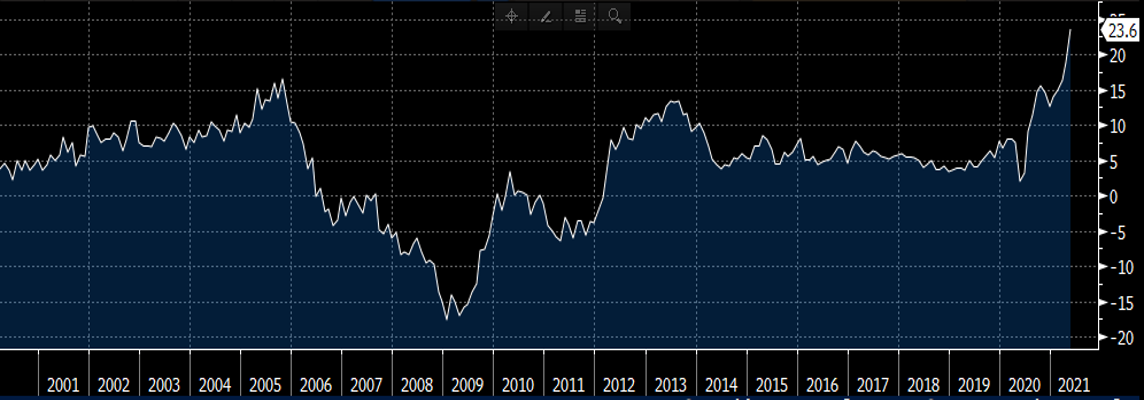
Chart1. Existing home price (y-o-y percentage move, source: Bloomberg, US commerce department)
In fact, it is not just property prices that are rising so quickly.
Also, in the U.S. the first half of 2021 has seen record equity inflows, which when annualized are greater than the previous 20 years combined!
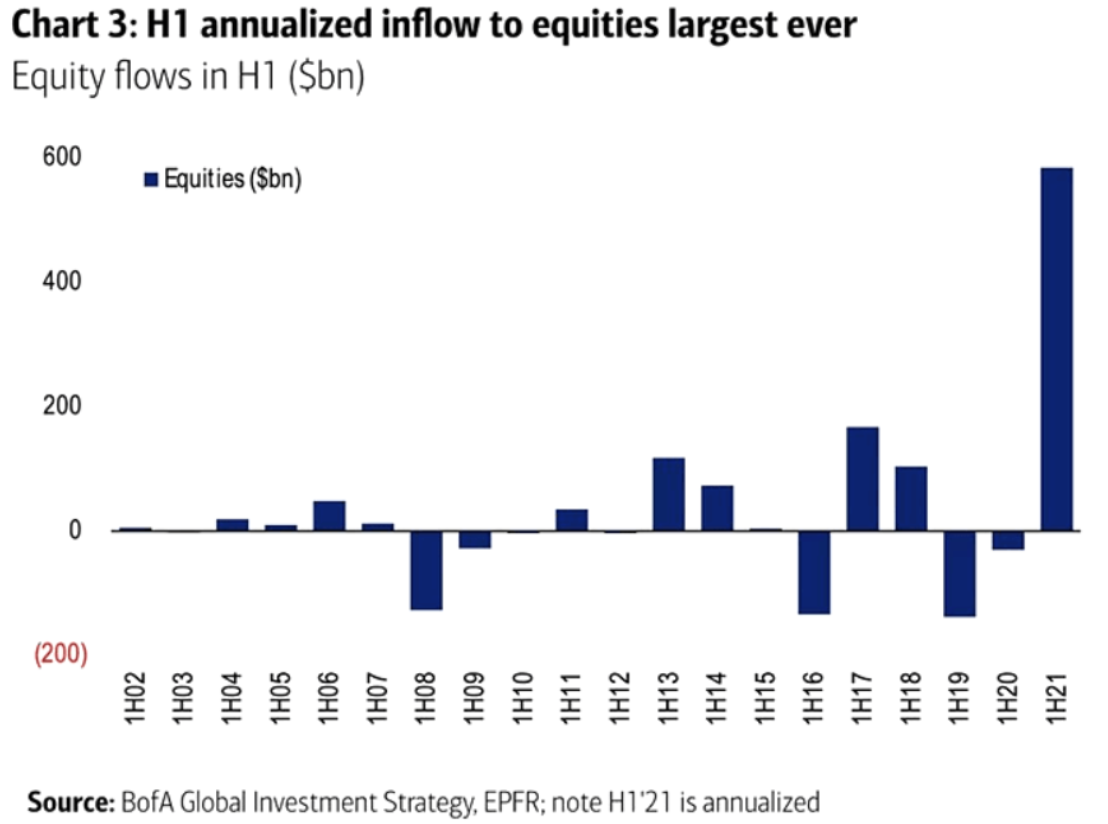
Chart 2. U.S. equity inflows (H1 2021 annualised, source BofA Global Investment Strategy, EPFR)
However, the last couple of months have seen property transactions hit a sudden headwind.
Yes, prices may still be trending higher, but transactions are abruptly falling. New home sales fell 7.8% in April and then 5.9% in May (US commerce department).
The long-term trend in sales is higher but this may have peaked as house prices have become increasingly unaffordable.
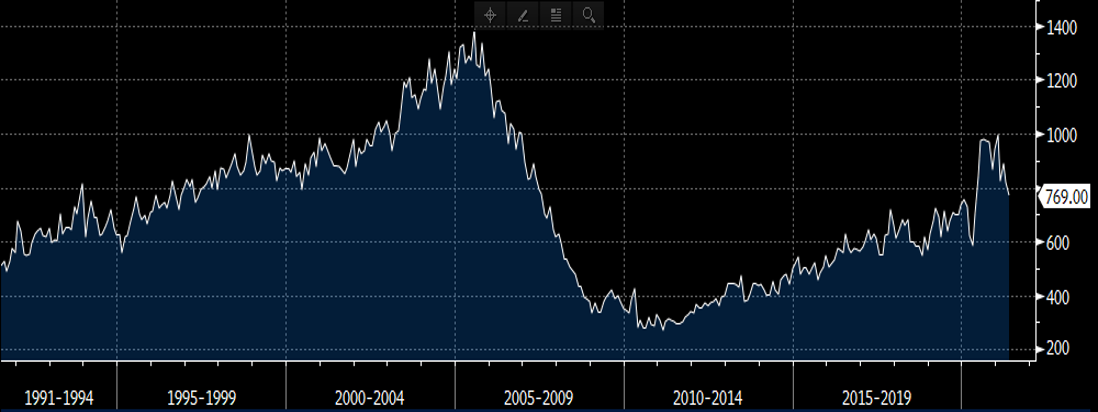
Chart 3. U.S. new home sales y-o-y (Source: Bloomberg, US commerce department)
The Organisation for Economic Co-Operation and Development (OECD), with 30 member countries, has found housing unaffordability has reached record levels, above the previous 2008 peak, when looking at house-price-to-income and house-price-to-rent indexes.
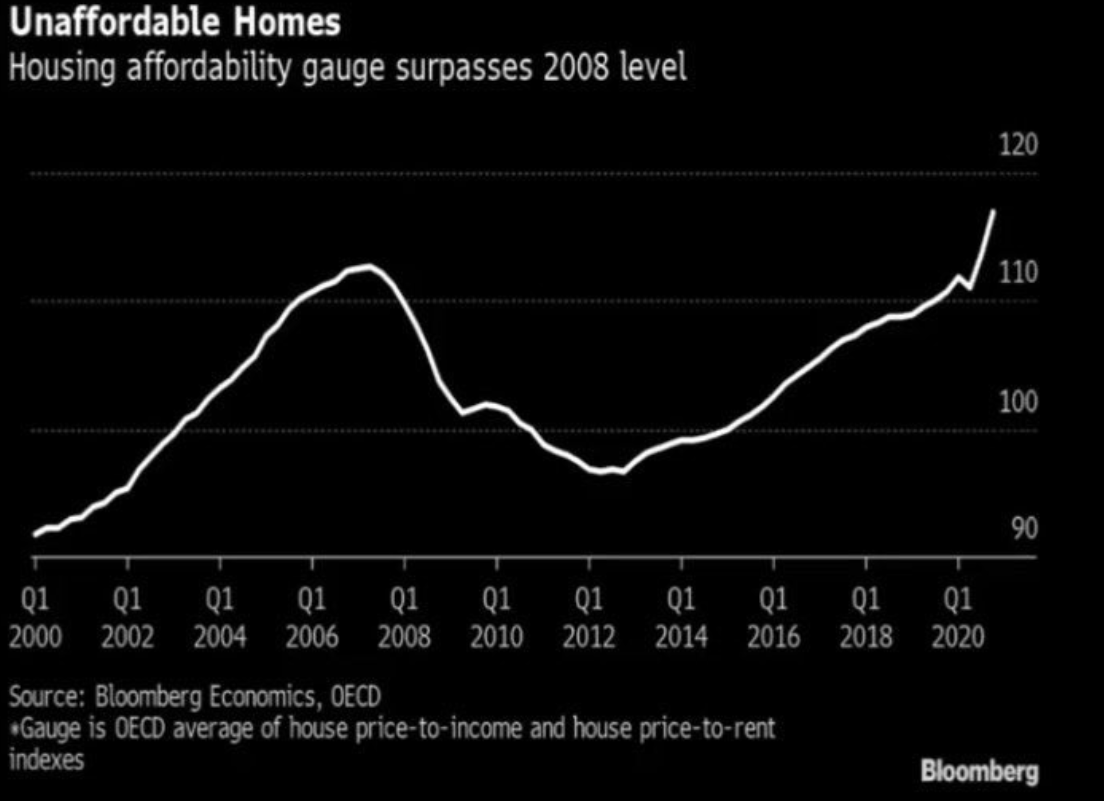
Chart 4. House price affordability gauge surpasses 2008 levels (Bloomberg, OECD)
This is supported by both the Conference Board and University of Michigan sentiment indicators in the U.S.
These have consumer home buying attitudes collapsing in June by over four standard deviations. The most abrupt reversal in over 40 years and to the lowest level on the Michigan survey since the index was first recorded in 1979.
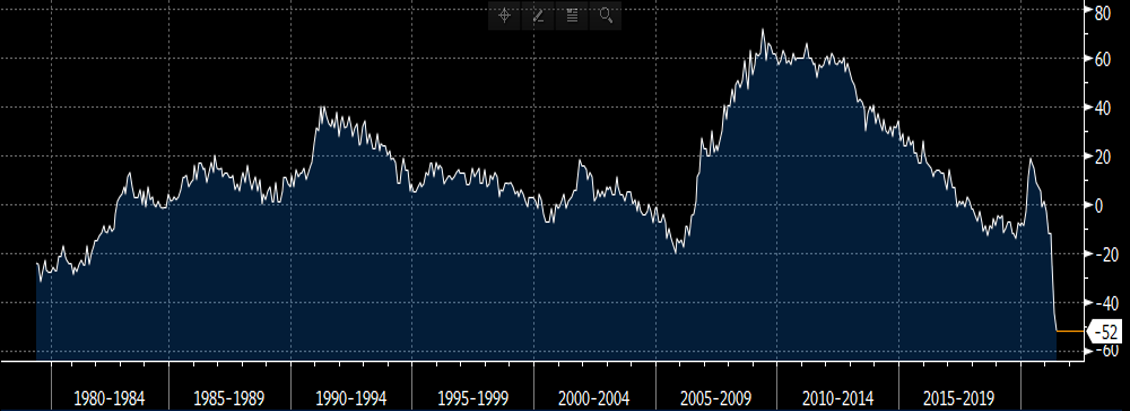
Chart 5. University of Michigan consumer home buying sentiment (Source: Bloomberg, Uni of Michigan).
So not only has residential property demand collapsed but the inventory and supply of homes is now suddenly increasing as well.
Inventory is now rising from record low levels at the start of Q2 2021 and both new housing starts, and authorized building permits are also rising.
So, it looks like the factors causing the record rise in house prices are now reversing. Demand is falling as homes hit unaffordable levels and supply is now rising as home builders rush to meet demand.
Emergency stimulus packages are beginning to be reversed and although the U.S. Federal Reserve has not announced the start of tapering, they are already draining liquidity from the markets with the 5bp rise in reverse repurchase agreement (RRP). Any further central bank announcement will likely raise yields and further damped mortgage demand. Equity prices are now at record valuations and interestingly crypto currency markets have fallen by over 50% since April, ‘coincidentally’ when U.S. house purchase transactions peaked.
The other concern of course is the weakening reflation trade.
This last week alone we have seen weaker than expected China PMI data, German ZEW data and U.S. ISM data.
Is the global economy starting to slow?
From a housing perspective this will likely show up first in ETF prices, notably ITB home construction and XHB home builders.
In this environment traders need to act more strategically. Using simple trade entry strategies, disciplined stop losses, effective position sizing techniques and eradicating human emotion (behavioral finance) traders can more consistently profit from both uptrends and down trends in asset markets.


