At first glance, the financial markets appear to be in good health.
The U.S. S&P and Nasdaq indices continue to make all time high prices, U.S. existing home prices rise 23.5% YoY, and there are now 1.4 million more job openings in the U.S. than unemployed workers (see chart below).
US households’ financial distress is at record lows due to increased cash balances, mortgage forbearance programs, and the perpetual student-debt freeze.
Inflation may have spiked to 5.4% YoY but the Federal Reserve call this ‘transitory’ and continue to pump $120 billion of quantitative easing into the economy each month. Yet the Fed now owns close to 25% of the TIPS market, up from 10% at the end of 2019, $160B of purchases.
This begs the question – is this sustainable?
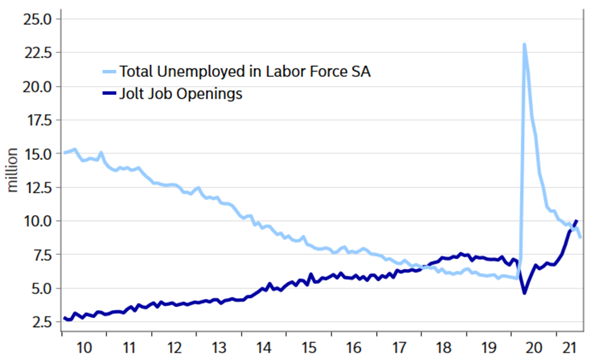
There are more job opening than unemployed. JOLT job openings versus total unemployed in the labor force. (Source: Macrobond and Nordea)
While asset prices are still trending higher, they are undoubtedly expensive on many metrics with several leading commentators calling this an ‘everything bubble’.
The Nasdaq has risen 123% from its COVID-19 lows in March 2020.
We have the largest long position ever, built with record leverage. The S&P 500 Price/Earnings ratio on Trailing Peak GAAP EPS is now at 30.8x, a 99% percentile level, only eclipsed by the December 1999 Nasdaq bubble.
Also, the S&P 500 real earnings yield remains negative at its lowest level since 1980 yet Wall Street is the most bullish on stocks in almost 2 decades with 56% of recommendations on S&P 500 firms as a ‘BUY’ or equivalent. Converting aggregated 12-month price targets for S&P 500 members implies about 10% upside for the index from current levels.
Also, the market cap of stocks with a price-to-sales ratio greater than 20 has hit $4.5tn, the only comparable time this happened in the last few decades was during the Dotcom Bubble in 1999. Even Warren Buffets favorite indicator, Global market capitalization divided by global GDP is at record levels, nearly 15% above above the previous 2007 peak (chart below).
Finally, the number of companies on the Nasdaq making new lows while the S&P 500 makes new all-time highs is at a 20 year high, less participation. Complacency?
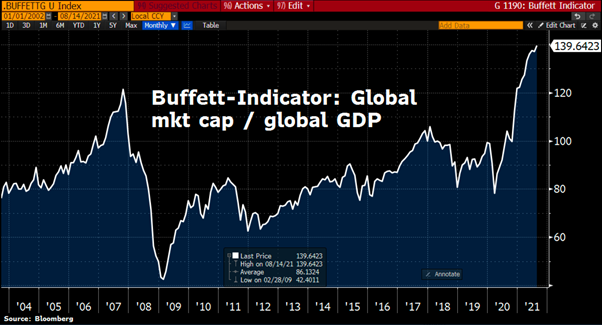
The Buffet indicator – Global market cap/global GDP (Source: Bloomberg, H.Zschaepitz)
However, there appear to be several cracks emerging in the global reflation story. Firstly, despite the strong U.S. employment data, other global economic data appears to be slowing quickly. China’s July data has been very weak, both retail sales and fixed asset investment, and this was before the recent flurry of lock downs as the Delta variant spreads across the country.
The US is now contributing more to global growth in 2021 than China, for the first time since 2006. Also, Beijing's refusal for months to support the debt of over-indebted property developers has terrified investors leading to existing home sales collapsing in many cities. The China credit impulse is contracting dramatically.
In the Eurozone we’ve seen a second consecutive fall in industrial production showing that PMIs do not translate well into real output.
A 0.3% decline in euro-zone industrial production in June, following a revised 1.1% decline in May, is not the recovery politicians were hailing, industrial production is now down 4% YTD. German ZEW economic expectations for July fell for a third straight month and Asia PMIs were also terrible with Vietnam, Malaysia, Indonesia and Thailand all well below 50. UK Business closures were higher in Q2 2021 than any Q2 since 2017.
As countries reopen, reality returns and we can expect the same in Eurozone.
In the U.S., the university of Michigan’s consumer confidence survey for July found buying conditions for durable goods, homes and vehicles at their worst since 1980. The overall consumer confidence number was also the biggest miss versus expectations since at least 1999, driven by rising coronavirus infections and inflation (read that as ‘cost of living’!) concerns. Even the slowdown in the Citibank economic surprise index is accelerating.
While stimulus payments massively skewed Q4 2020 and Q1 2021 data, and with the delta variant rising in the U.S. and lock downs rising across China, SE Asia and Australia the signals are for worse economic data to come.
Despite strong growth in global house prices and a 23.5% rise YoY in existing home sales in the U.S. building permits have fallen 15.4% since January 2021 and far more alarmingly new home sales have fallen 32%. Over the past year, mortgage originations have totaled nearly $4.6 trillion, accounting for a staggering 44% of all outstanding home loan balances. Any fall in house prices would further dent an already weak consumer confidence.

CPI appears to be anything but ‘transitory’ at the moment with PPI raising concerns, too.
The annual jump in US Producer Prices in July was the biggest on record. The producer price index for final demand increased 7.8% YoY and 1% from the prior month (Labor Department data).
Baltic dry index shipping rates just hit the highest level since 2009 as the world’s third busiest port, China’s Ningbo-Zhoushan remains partially closed, further restricting the global supply chain.
As consumers and politicians show greater unease with inflation, then the more likely the Federal Reserve are to start tapering and reduce liquidity. Possibly at the worst time.
WCI Composite container freight index (Source: Bloomberg)
A big driver of inflation was undoubtedly surging commodity prices. But lumber has given back all of its post COVID gains, and Iron ore price has fallen -26% since its May high.
In fact, crude oil is close to breaking $ 65.21 support signalling a downtrend, and likely weakening the whole commodity price complex (and commodity currencies).
Crude oil futures. A break below
the red 65.15 support line will see liquidation of longs and have a weakening
affect across commodity markets and inflation data. (Source: Bloomberg)
High yield spreads have also widened marginally since early July while equities keep on marching higher.
An interesting divergence which generally gets solved one way or the other. The fact that sovereign yields are falling again is also of concern. Last week several wall street banks revised higher their U.S. 10-year bond yield end of year forecasts only to see yields crushed on the weak consumer confidence data.
A close below the recent double bottom of 1.125% would see a rapid unwind of bonds market short positions and yields falling yet further.
Money supply has received very little play, but the money boom just ran out of gas. M2 stagnated in June for the first time in 3 years and real M2 contracted 0.8% — the history books suggest this could be a recessionary signal.

Recent weeks we have seen a stronger dollar. Especially bad news for emerging markets and commodities. But the last week we have seen renewed strength in the Japanese Yen, typically correlated with lower bond yields and a deflationary sign. Another signal that the global recovery is being derailed.
AUDJPY closing below 79.84 and EURJPY closing below 128.60 will see another leg lower and further ‘RISK OFF’ deleveraging.
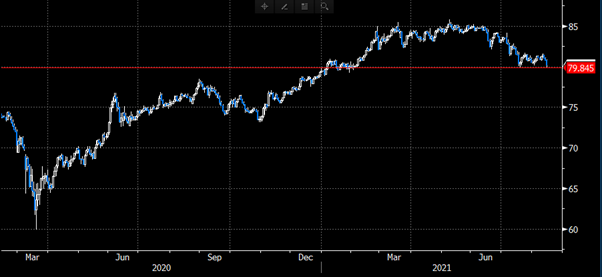
AUDJPY sitting just above crucial 79.84 support. (Source: Bloomberg)
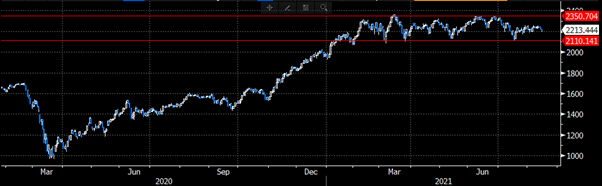
So back to the equity markets. While S&P and Nasdaq grind higher on lower participation two key indices to watch for warning signals are the Nikkei (an early 2020 leader) and the Russel 2000 both seen here close to key support levels.
As lockdowns increase across China, SE Asian ad Australia a break below 27,330 will see a rapid unwind of long positions, highly correlated to the FX currencies ‘RISK OFF’ trade.
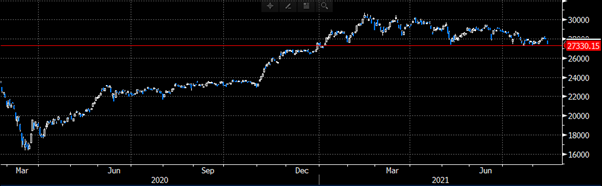
Nikkei testing 27,330 support. A break below here will see rapid unwind of long positions.
Similarly, the Russel 2000 is trapped in an 8-month range. A break above 2,350 and the market adds to longs. But we already know that institutions are liquidating positions into retail buying. The risk is a break below 2,110 where algorithms will be selling first and retail ‘bag holders’ last.
So, despite continued strength in the market ‘cheer leaders’, the U.S. S&P index and the Nasdaq we are seeing early signs of weakness across global economic data, housing transactions, commodity markets, FX markets, money supply data and bond yields.
Control emotion and manage risk. Trade what’s happening, not what you think is going to happen!